


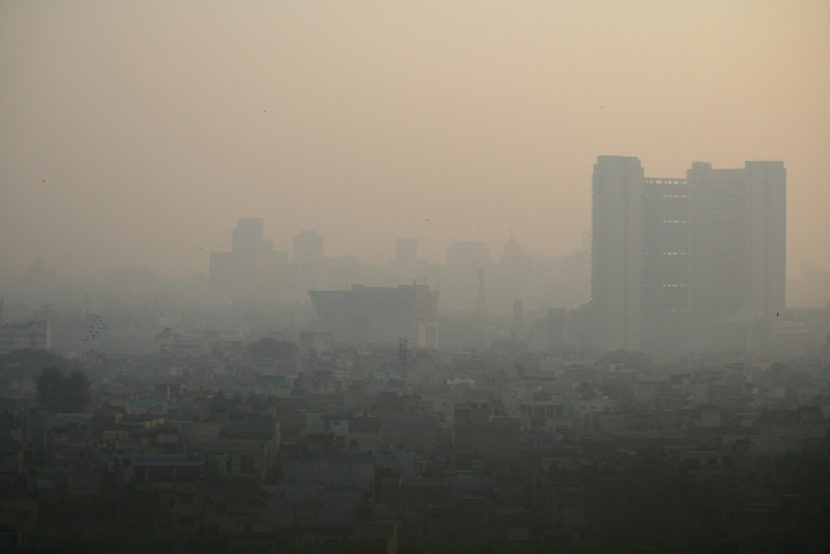
Poor air quality is caused by motor vehicle emission, fires on agricultural land, dust from construction sites, burning garbage, industrial activities etc. Aapah innovations have been monitoring the air pollution in Delhi using remote sensing data.
In this analysis, we used daily Aerosol Optical Thickness (AOT) at 0.55 micron, which was extracted from MODIS MOD04_3K product. It has a spatial resolution of 3km. Tiny solid and liquid particles suspended in the atmosphere are called aerosols. Examples of aerosols include windblown dust, sea salts, volcanic ash, smoke from fires, and pollution from factories ((https://neo.sci.gsfc.nasa.gov/view.php?datasetId=MYDAL2_M_AER_OD)). AOT is the measure of aerosols distributed within atmosphere from the satellite. Value of AOT less than 0.1 indicates clear sky whereas a value of 4 indicates the presence of aerosols so dense that difficult to see the Sun even at afternoon.
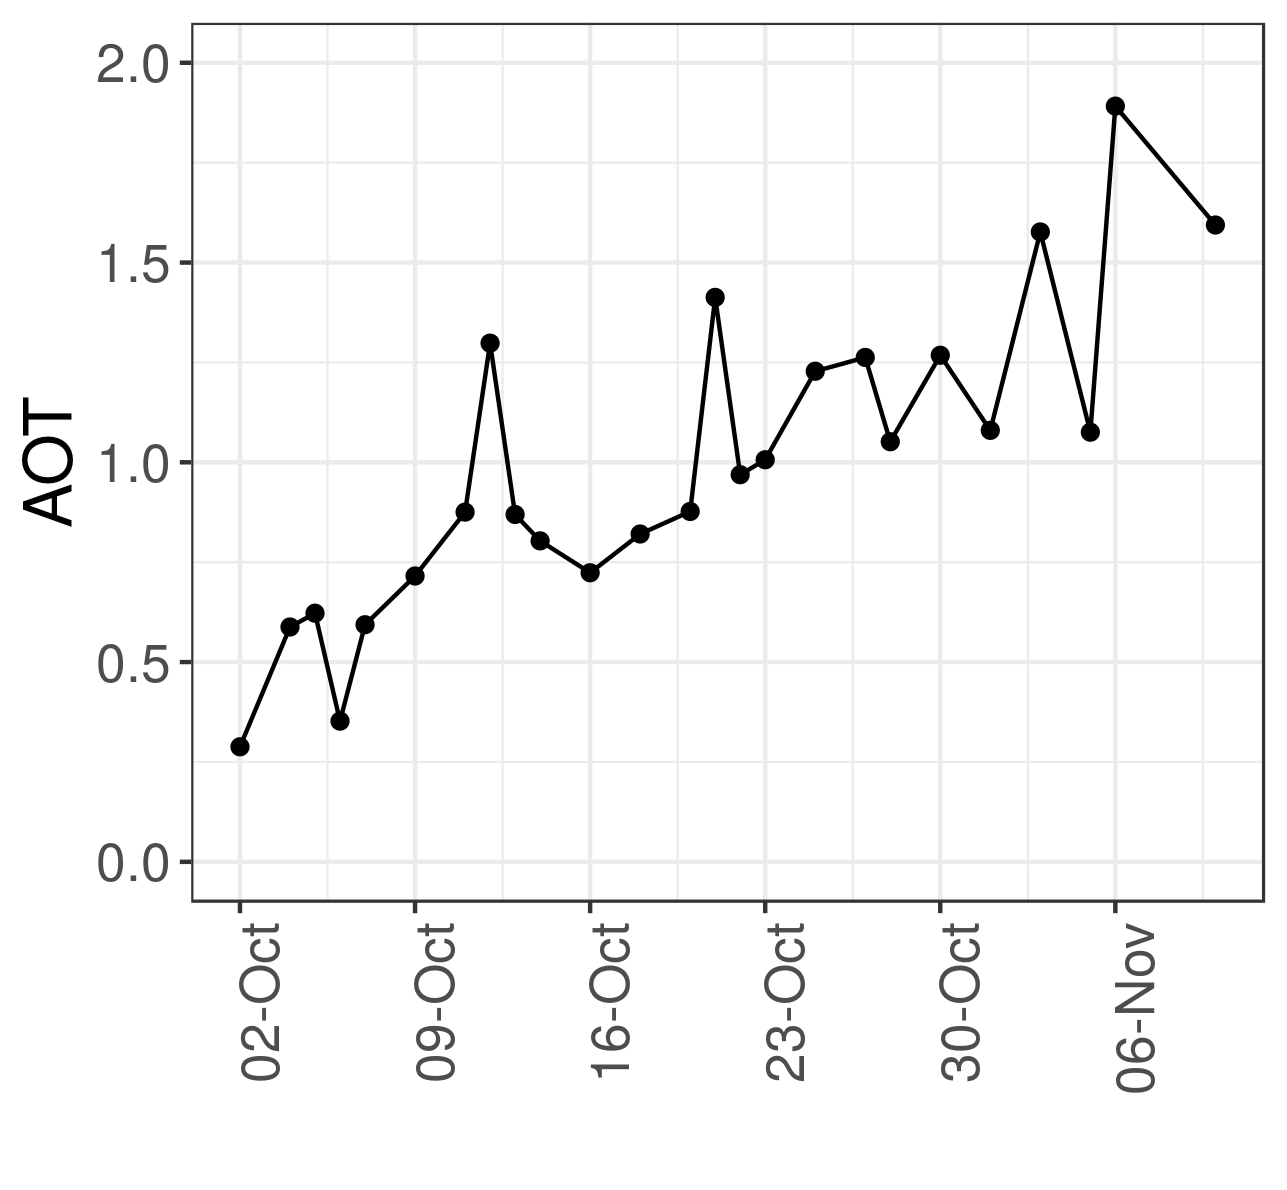
Figure 1 shows AOT time series data for Delhi from 1st October to 10th November 2017. In October month, on 12th and 21st day AOT value is relatively high (1.29 and 1.41, respectively) which indicates poor air quality ((http://indianexpress.com/article/cities/delhi/ahead-of-diwali-delhis-air-already-turns-poor-govt/)), ((http://www.businesstoday.in/current/economy-politics/delhi-diwali-2017-pollution-24-times-higher-despite-supreme-court-ban-on-crackers-sale/story/262326.html)). AOT is increased in November month compared to October due to crop burning activities in agricultural area ((https://www.forbes.com/sites/leezamangaldas/2017/11/08/delhis-government-declares-a-public-health-emergency-as-air-pollution-chokes-the-city/#39244e602a5a)).
Figure 2 shows the spatial map of weekly average AOT from October to November 2017 over Delhi. In the first week of October, average AOT was around 0.7. The weekly average AOT value was around 1.2 to 1.3 from 2nd week of October to 1st week of November. The 2nd week of November showed the maximum weekly average AOT (1.5) compared to other weeks. The remote sensing data enables to continuously monitor the air pollution of the large regions at regular intervals.
[cta id=”1542″ vid=”0″]